01 ·
The bearish count is dead. A cyclical bull sequence begins.
The turn the whole sequence rests on. Everything up to the top called on 10 July is the advance that starts here.

Bottom Line:
May Cocoa shattered our invalidation ceiling with a forceful rally, completely negating the bearish setup. We have pivoted our primary scenario to a bullish macro structure, currently tracking a powerful third-of-a-third upward thrust.
Summary:
- Since the last update: Sellers entirely failed to materialize. Instead, buyers drove the market forcefully through our 2549 invalidation line. Despite the aggressive momentum, the thrust was cleanly capped perfectly within our higher 2610/2619 key resistance zone.
- Lead scenario: The bearish count is dead. The choppy price action we were tracking was actually masking a leading diagonal for purple wave (i). The market is now executing a highly aggressive third-of-a-third advance. We have updated both the daily and weekly macro labels (minor waves 1 and 2) to reflect this broader bullish reversal.
- Alt scenario: To protect this newly established bullish count, we have placed a strict structural invalidation floor at 2445. A drop below the 2500 alt trigger would serve as an early warning of near-term weakness, but as long as 2445 holds, the bulls are in control.
- Big picture [UPDATED]: May Cocoa appears to have completed its multi-month macro correction and is initiating the early stages of a new cyclical bull sequence.
Note: the oldest chart here. Its grid lines carry a bracketed verdict, [ACTIVE], [HELD], [BREACHED], in place of a glyph; the thesis lines read Lead Scenario Trigger, Alt Scenario Trigger and Lead Count Invalidation Level; and both panels are the continuous series.
02 ·
Marking the end of ((iv)), and drawing ((v)) of 3 to 3,625.
The 3,319 line added here triggered the same session, which closed at 3,486, the first target. The chart puts the top of 3 at 3,625 on 12 May: it printed 3,549 that day, 76 points under the line.

London Cocoa (July) | Pre-Opening
Publication Time: May 11, 2026 · 10:47 (GMT+3)
Outlook: Neutral then Bullish | Wave ((iv)) extended down through 3188 but held 3122; 3115 Early Warning not cleanly closed below. Possible one more dip to 3062 / 3036 before wave ((v)) of red minor wave 3 up.
- A clean break above the new 3319 Early Tell will hint that wave ((v)) up has started.
- The market may dip once more to 3062 / 3036 (with 2935 as deeper fallback) before reversing.
- A clean close below 3115 will warn us the count is in trouble. Line in the Sand at 2536.
Tracking prior call (May 8, Intraday): wave (c) of ((iv)) heading toward 3236 / 3188 / 3115 key levels for a reaction; after wave (c) bottoms, wave ((v)) up targets 3486 / 3625; below 3115 = early warning, Line in the Sand at 2536.
Status:
- ✓ Wave (c) reached and breached 3236 and 3188 — the first two key levels on yesterday's path.
- ✓ The 3122 key level held (just above 3115 EW).
- ⏳ The 3115 Early Warning was approached but not cleanly closed below; count alive.
- ⏳ Wave ((v)) up still pending; possible one more dip to 3062 / 3036.
Preferred count [Repeating]:
Wave ((iv)) of red minor wave 3 is extending down as a flat (a-b-c). Wave (c) of ((iv)) has reached the lower key zone, breaching 3188 but holding 3122 with the 3115 Early Warning not cleanly closed below. One more dip to 3062 / 3036 (with 2935 as deeper fallback) cannot be ruled out before wave ((v)) of red minor 3 launches up. New Early Tell at 3319 added to give early signal of wave ((v)) start.
Big Picture [Repeating]:
Bullish. Cocoa has completed its multi-month macro correction and is propelling into a new cyclical bull sequence.
Long-term Early Warning below 2649. Long-term Invalidation below 2419.
Lior Mor
Note: Before July the chart names each thesis line on itself, as Early Tell, Confirmation, Early Warning or Invalidation; levels are marked ✓ or ✗ rather than with a glyph, and the lines are drawn in blue, orange and maroon.
03 ·
Calling the top of 3 of (3).
The high printed an hour after this went out, at 3,549. Cocoa then fell 22.6% over the ten days that followed.

London Cocoa (Jul 2026) | Pre-Open
May 12, 2026 · 10:24 (GMT+3)
Neutral. Approaching a minor top at the listed key levels. The market closed exactly at 3486 and used the 3449–3418 zone as support. Reaching 3525 / 3569 / 3625 is possible but not necessary. Above that we may be in an extended wave ((v)) of red wave 3.
Big Picture: Bullish. Weekly wave (3) progressing higher toward 4051. Below 2649 warns; below 2419 invalidates.
Projection Score: ✓2 ⏳2
✓ 3486 reached and respected as resistance. ✓ 3449–3418 zone held as support. ⏳ 3525 / 3569 still ahead. ⏳ 3214 EW and 3084 Invalidation active.
— Lior Mor
Note: Before July the chart names each thesis line on itself, as Early Tell, Confirmation, Early Warning or Invalidation; levels are marked ✓ or ✗ rather than with a glyph, and the lines are drawn in blue, orange and maroon.
04 ·
Calling the end of 4, relabeled (4), but it was only A of a triangle.
The count changes here with no line fired, on an alternation argument alone. The post opens by scoring its own previous call wrong.

London Cocoa (Jul 2026) | Pre-Open
May 26, 2026 · 10:28 (GMT+3)
Bullish then Neutral. The bearish call from Friday was wrong: Cocoa held the 2,742 area and rallied. The 2,746 low now looks like the bottom of wave ((c)) of Y of (4). Small relabel: we've increased the degree, so we're now finishing wave (4), with alternation between waves 2/4 and (2)/(4) reading better. Below 2,742 invalidates. A close above 2,957 will be the first hint the market is heading higher; a cross above 3,351 will be a major signal.
Big Picture [Updated]: Bullish. Wave (4) finishing as part of an ongoing wave (3) up toward 4,051. Below 2,649 warns; below 2,419 invalidates.
Projection Score: ✗1 ⏳1
✗ Friday's bearish call was wrong; Cocoa held 2,742 and rallied. Degree relabel (academic, not scored) puts us at the end of wave (4). ⏳ Bullish recovery pending; close above 2,957 first hint, above 3,351 major signal; below 2,742 invalidates.
— Lior Mor
Note: Before July the chart names each thesis line on itself, as Early Tell, Confirmation, Early Warning or Invalidation; levels are marked ✓ or ✗ rather than with a glyph, and the lines are drawn in blue, orange and maroon.
05 ·
Reading the triangle done, or nearly so.
The thesis line named here triggers the next session, and the next post is the switch.

London Cocoa (Jul 2026) | Post-Close / Pre-Open
June 11, 2026, 23:34 (GMT+3)
Neutral then Bullish. Cocoa kept consolidating, holding the hint and warning levels, so little to add. We still lean toward the down move being wave E, up either way. A close above 2,968 hints; above 3,028 reinforces; above 3,264 reinforces even further. Below 2,864 rings an alarm and points to wave C of (4) as an ending diagonal; below 2,742 invalidates.
Big Picture [Repeating]: Neutral then Bullish. Triangle (4), possibly in wave C or E. A close above 3,030 hints; above 3,263 reinforces; below 2,784 rings an alarm; below 2,640 invalidates.
— Lior Mor
Note: I'm out of office until next week; daily coverage resumes on my return.
Note: Before July the chart names each thesis line on itself, as Early Tell, Confirmation, Early Warning or Invalidation; levels are marked ✓ or ✗ rather than with a glyph, and the lines are drawn in blue, orange and maroon.
06 ·
Calling triangle (4) done, and the key levels for (5).
The switch the previous post set up, taken once its thesis line triggered. Wave (5) is what the next two posts ride.

London Cocoa (Sep 2026) | Post-Open
June 15, 2026, 13:34 (GMT+3)
Neutral then Bullish. Friday's dip below 2,864 negated the E scenario and switched us to the C alt. Cocoa formed a small D and E, then this morning thrust out of the triangle in what looks like wave (i); we now seem to be in wave (ii). The alt: this is just ((c)) of D, with price action to decide. A close above 3,154 hints; above 3,262 reinforces; below 2,937 rings an alarm; below 2,845 invalidates.
Big Picture [Repeating]: Neutral then Bullish. Triangle (4), possibly in wave C or E. A close above 3,030 hints; above 3,263 reinforces; below 2,784 rings an alarm; below 2,640 invalidates.
— Lior Mor
Note: Before July the chart names each thesis line on itself, as Early Tell, Confirmation, Early Warning or Invalidation; levels are marked ✓ or ✗ rather than with a glyph, and the lines are drawn in blue, orange and maroon.
07 ·
Recognizing the triangle early, between two key zones.
The levels behind this page did their work on the way up. The market now congests between 3933–3875 above and 3715–3673 below, and the triangle is called while it is still forming.

London Cocoa (Sep 2026) | Post-Open
July 02, 2026, 12:50 (GMT+3)
Bullish. Price couldn't breach 3875-3933 or trigger our 3874 line, going sideways in a triangle; now in wave ((c)) of 4. Expect ((d)) and ((e)) before the thrust up in wave 5 of (5) toward 4129/4203. A close above 3874 adds confidence, above 4019 boosts; But, below 3661 lowers it, 3424 drops.
Big Picture [Repeating]: Bullish. Triangle (4) is done; we're now in wave (5) up toward 4,051, or alt wave 1 of (5). Below 2,897 lowers confidence; below 2,638 invalidates.
— Lior Mor
08 ·
Calling the top of the whole advance.
The session ran to 4,827 before closing back below. The wave (A) target set here, 3715–3673, is what the 28 July post collects.

London Cocoa (Sep 2026) | Pre-Open
July 10, 2026, 11:03 (GMT+3)
Bearish. Our alt for one more high was right: price stopped at 4714, tested the 4764-4794 zone, then closed beneath it. The wave (5) top may be in, or needs one more push, before a sharp reversal into wave (A) down toward 3715-3673. Close below 4586 adds confidence, 4439 boosts.
Big Picture [Repeating]: Bullish. Triangle (4) is done; we're now in wave (5) up toward 4,051, or alt wave 1 of (5). Below 2,897 lowers confidence; below 2,638 invalidates.
— Lior Mor
Research, not investment advice. Trading carries risk of loss.
Note: Intraday counts turn before the weekly frame catches up, so a Big Picture line marked [Repeating] can still describe the prior state.
09 ·
Re-reading a correction that kept changing shape.
The short-term bottom call was right; reading it as the end of (A) was not, and the next post corrects it.

London Cocoa Futures (Sep 2026) | Post-Open
July 20, 2026, 13:40 (GMT+3)
Bullish, cautiously. Instead of C of (A), price action better fits W-X-Y of (A) done, ((a)) of A of (B) missed 4298, ((b)) double-bottomed at our 3954, ((c)) up next. The ((iii))-of-C alt stays strong. A close above 4102 adds, crossing 4289 boosts; But, crossing below 3954 lowers, a close below 3856 drops.
Big Picture [Repeating]: Neutral then Bullish. Wave (5) of ((A)) has topped, and we're now in wave (A) of ((B)) toward 3477/3304/3241 in a multi-week correction. A close below 3742 adds confidence; But, a close above 4473 drops, a cross above 4782 invalidates; a cross below 2,638 drops.
— Lior Mor
Research, not investment advice. Trading carries risk of loss.
10 ·
Calling the bottom of (A), and the multi-week rally to come.
The 10 July target of 3715–3673, refined up to the 3,768 line on 13 July, between these two posts. Price bottomed at 3,758 that afternoon, about three hours after this went out.

London Cocoa Futures (Sep 2026) | Pre-Open
July 28, 2026, 11:16 (GMT+3)
Neutral then Bullish. Our ((X)) alt played out: 3907 fired and the drop resumed. (a) and (b) are done; (c) of ((y)) of Z of (A) should bottom soon, reversing higher in A of (B) up. A close above 3907 adds confidence, close above 4150 boosts; But, a cross below 3674 drops.
Big Picture [Updated]: Neutral then Bullish. Wave (A) is bottoming; next, a multi-week rally as part of wave (B) of ((B)). A close above 4178 adds confidence, a cross above 4501 boosts; But, a close below 3742 lowers, a cross below 3483 drops.
Lior (Lee-or) Mor | QuadriviumAnalytics.com
Research, not investment advice or a personal recommendation. The author trades the markets discussed. Trading carries substantial risk of loss.
11 ·
After 9 days and 812 points, calling the top of (B), and the turn into (C).
The invalidation is set at the high itself, so this call is either right or it is finished.
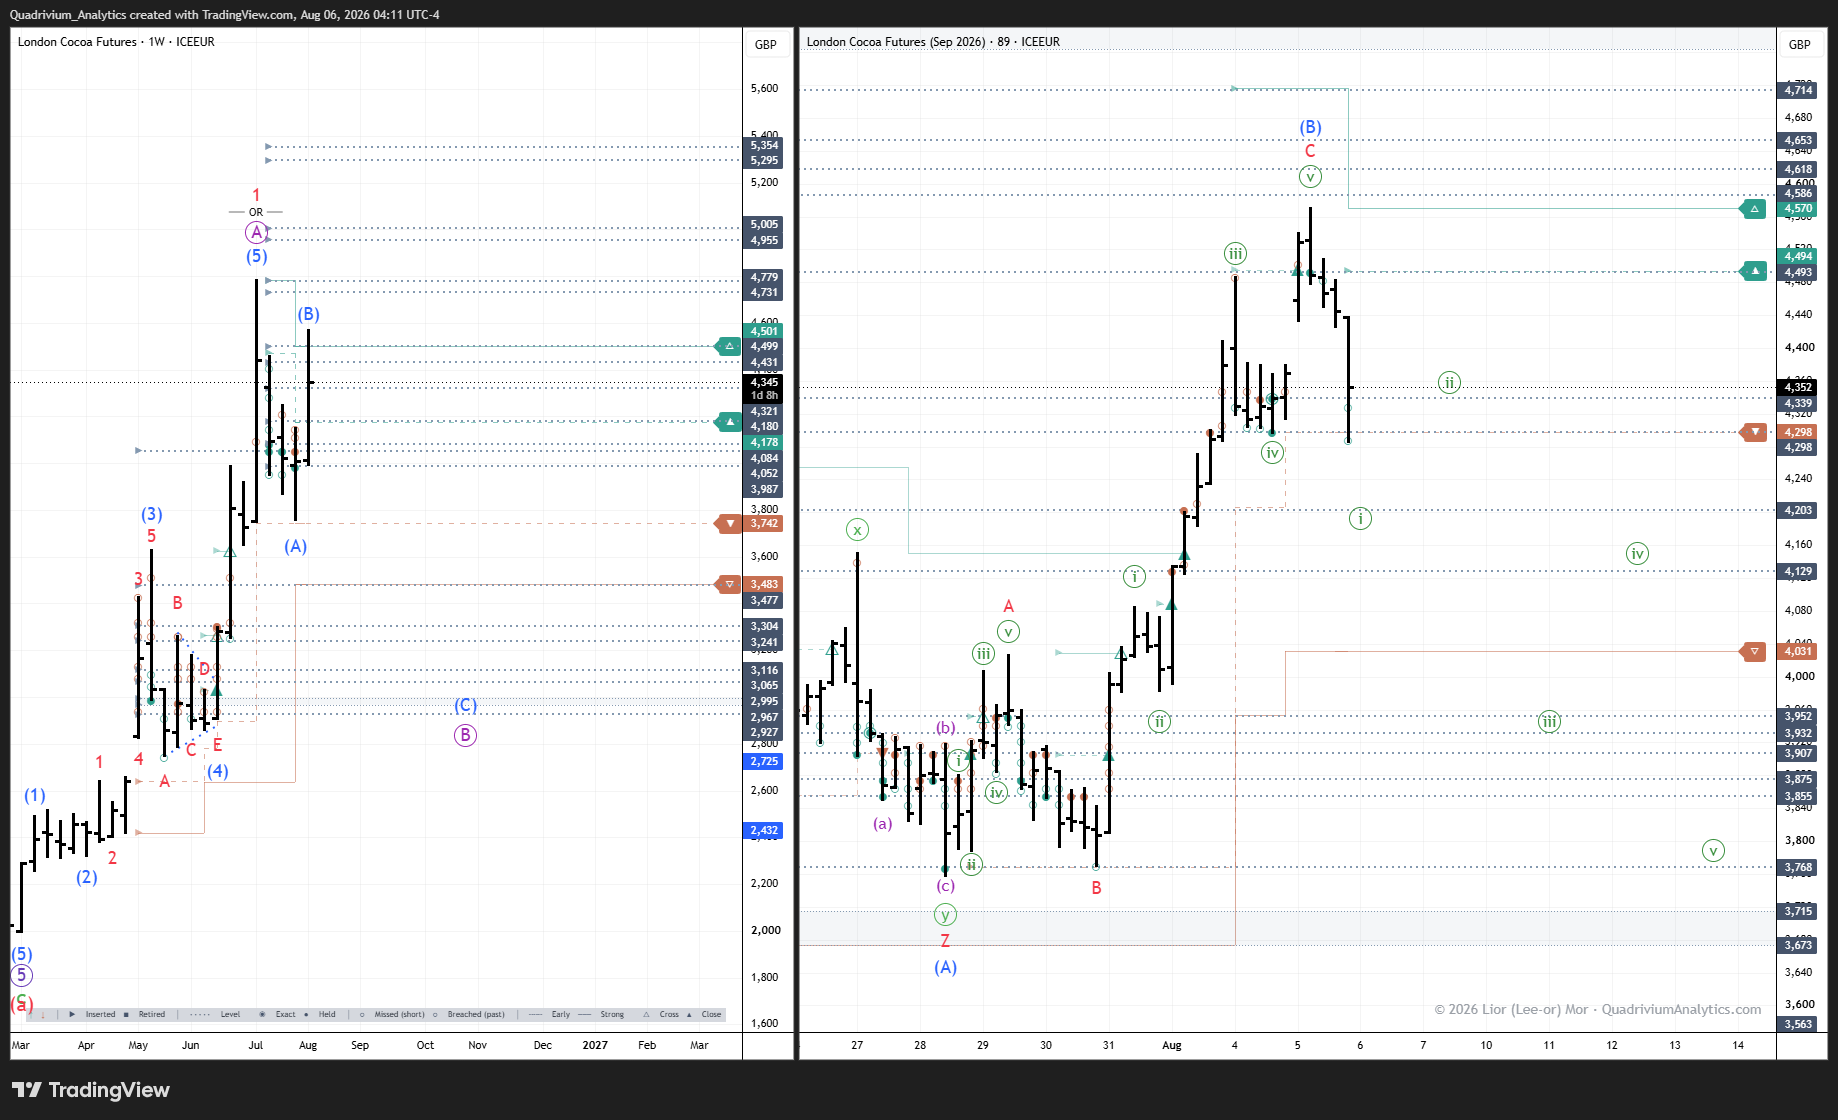
London Cocoa Futures (Sep 2026) | Pre-Open
August 6, 2026, 11:11 (GMT+3)
Bearish. The ((v)) surge came as called and fired our 4495, topping at 4570, 16 short of the 4586 line, then fell hard. We read ((i)) of 1 of (C) of ((B)) down. A close below 4298 adds confidence, cross below 4031 boosts; But, a close above 4493 lowers, crossing 4570 invalidates.
Big Picture [Repeating]: Neutral then Bearish. The multi-week rally in (B) of ((B)) is underway. A cross above 4501 boosts; But, a close below 3742 adds confidence that (C) of ((B)) is underway, and a cross below 3483 boosts it.
Lior (Lee-or) Mor | QuadriviumAnalytics.com
Research, not investment advice or a personal recommendation, and no substitute for advice that takes account of your own circumstances and needs. The author trades the markets discussed. Trading carries substantial risk of loss.
Note: Intraday counts turn before the weekly frame catches up, so a Big Picture line marked [Repeating] can still describe the prior state.
Reading the charts
- Reading a thesis line
- Three parts. Its weight: dashed is Early, solid is Strong. Its trigger: a filled glyph needs a close beyond the line, a hollow one only a cross. Its color: the direction the trigger fires, teal upward and clay downward, whichever way the count leans. Color is the direction the trigger fires, never a verdict on the count.
- The line as a ledger
- A line begins at the bar it was drawn on, before price reached it, and steps at each bar where it moved, so the chart carries the date it was set and every revision since. A trigger stops it there: the glyph prints on the bar that did it, and the line fades and gives up its price chip. A live line carries one on the axis; a fired one does not.
- What the post names
- Every chart carries thesis lines, Key Levels and Key Zones: dotted lines and shaded bands for the grid, tagged and colored lines for the thesis. The post names a few of them, the ones that matter to that day's read. The rest stay on the chart until they trigger or are retired.
- The alternate count
- Published with the primary rather than after the fact: the alt in the text, and on the chart a label carrying OR. Where two are drawn, the nearer is the primary and the farther the alternate.
- Big Picture tags
- [Repeating] means the Big Picture paragraph is unchanged from the previous day's post; [Updated] means it moved. These pages are a selection, so the previous day's post is rarely the previous page here, and some posts carry neither tag.
- Provenance and timestamps
- Any highlighting is ours, and every page carrying one says so in its label. The time shown is the one the post states, or its recorded timestamp where the post states none. Each chart also carries its own TradingView export stamp, in whatever UTC offset it was exported under, so it will not always read the same as the time on the page; the earlier charts are the same account under an earlier handle.
- Panels and paragraphs
- The left panel carries the levels named in the Big Picture paragraph; the right panel carries those named in the lead paragraph. Every price the post states is drawn on the panel it belongs to. The contract rolls inside this deck, so the right panel changes series partway through: a level can sit at a different price on the two panels, or appear on only one.
The sequence ends at the window's close. Current notes are delivered on trial.
The other market: the wheat sequence.
Two weeks: the notes for the covered markets, by email.
Request trial access